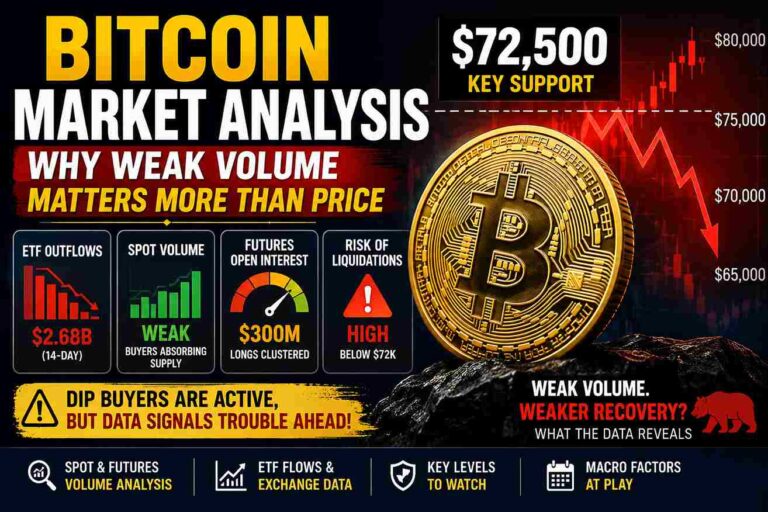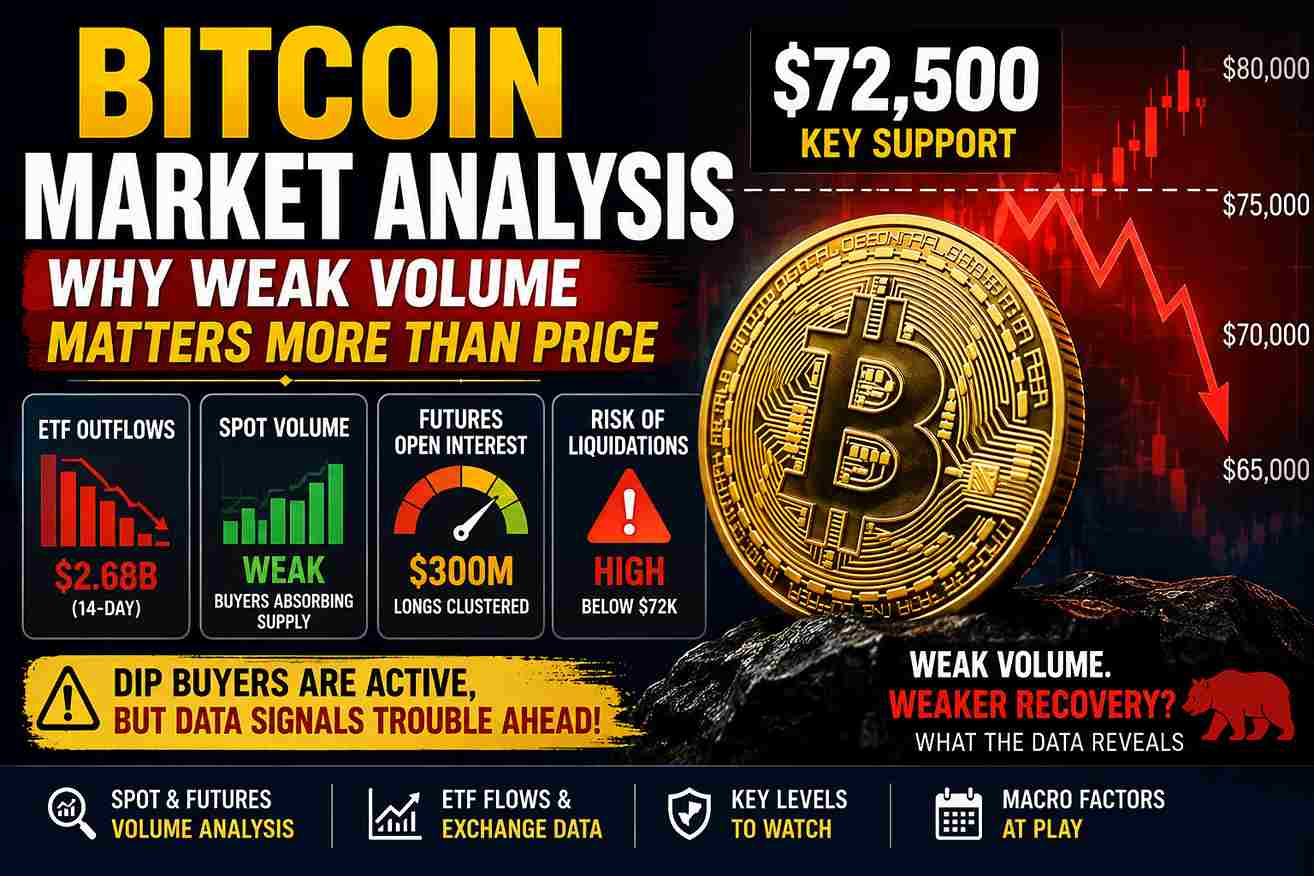
Bitcoin remains above key support, but weakening spot and futures volume suggest the recovery may not be as strong as price action implies.
Bitcoin Dip Buyers Are Active, But Spot and Futures Data Raise Red Flags
Bitcoin has historically rewarded investors who step in during structural market corrections. Today, retail dip buyers are actively defending the $72,000 level. Despite this visible support, spot and futures market data suggest the current recovery lacks strong conviction. When you look under the hood of the recent price stabilization, the underlying volume dynamics reveal significant structural vulnerabilities.
Market structure indicators show that the buying activity halting this sell-off lacks the aggressive momentum needed to reverse the broader trend. Current exchange flows, cumulative volume delta (CVD) metrics, and futures open interest all point to a market floating on thin liquidity.
This analysis breaks down the latest institutional ETF outflows and reviews the imbalances in the derivatives market. We will also outline the exact data points required to confirm a true bullish reversal.
Why Weak Volume Matters More Than Price
In financial asset evaluation, price is the advertisement, but volume is the truth. When major sell-offs occur, inexperienced traders focus entirely on the fact that the price stopped dropping. Professional market participants look closely at the quality of the volume that halted the decline.
The market is currently exhibiting a phenomenon known as “negative demand.” Bitcoin has temporarily stabilized near $72,500. However, spot CVD data indicates that buyers are merely absorbing incoming supply. They are placing passive limit-order walls to catch the asset as it falls. If true institutional demand were driving this action, we would see a sharp recovery backed by expanding spot volumes across major exchanges.
A price bounce built on weak volume is structurally fragile. It suggests the market is holding up due to a temporary lack of aggressive sellers, rather than the presence of convicted buyers. If macroeconomic sentiment shifts, these low-volume support floors can break rapidly.
The Institutional Catalyst: ETF Outflows and Exchange Inflows
To understand the current ceiling on Bitcoin’s price, you must examine the institutional capital flows dictating the broader trend. The introduction of spot Bitcoin ETFs altered the liquidity profile of the asset class. They act as a highly efficient two-way street for capital.
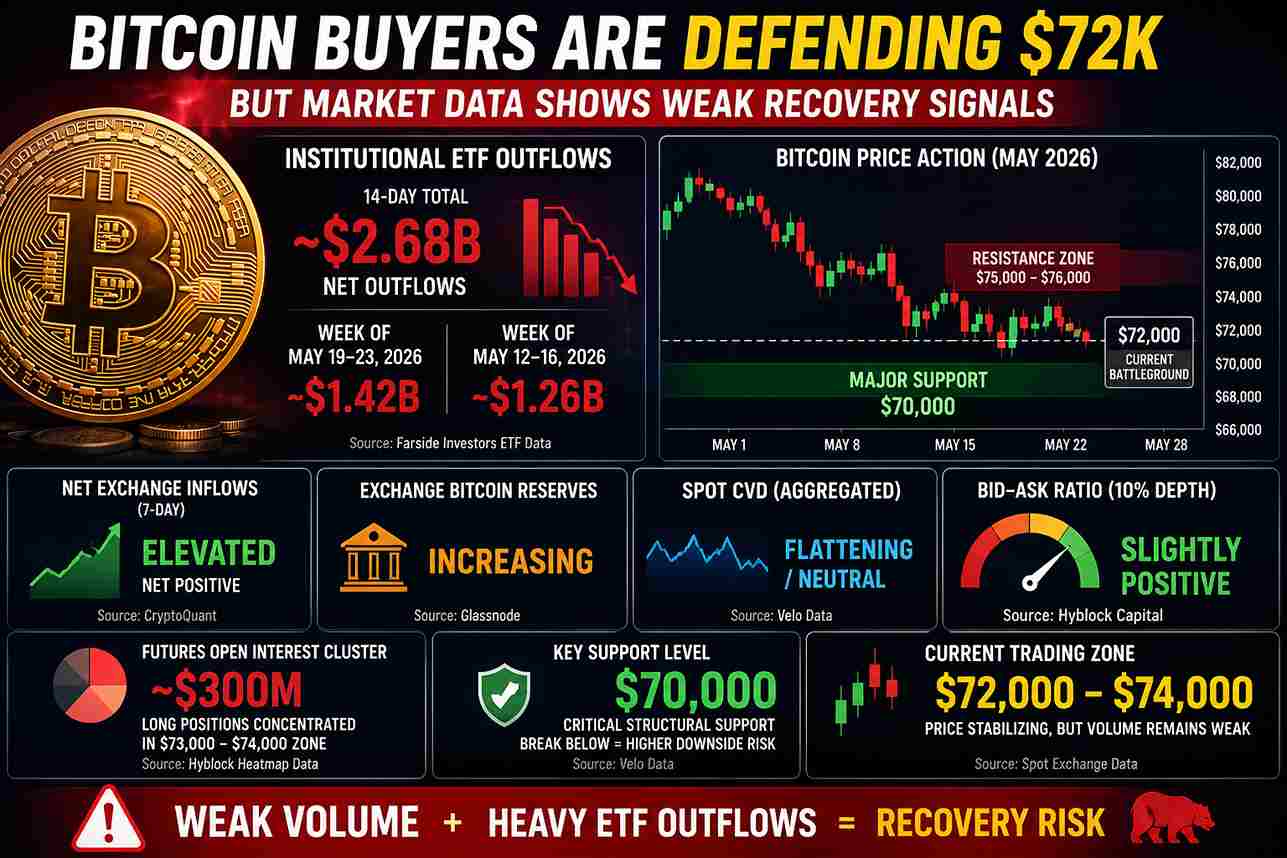
Recent institutional flow tracking shows that ETF selling has overwhelmed the spot markets. Data points to a substantial $1.42 billion in outflows for a single week. This compounds a $1.26 billion drain from the previous week. When nearly $2.68 billion exits the ecosystem in a 14-day window, it forces market makers to recalibrate their hedges. This places intense downward pressure on spot valuations.
Bitcoin Quantum Threat: Why the Bigger Risk May Not Be Wallet Keys
On-chain metrics reveal a direct correlation between these ETF redemptions and subsequent Bitcoin inflows to major exchanges. When institutional entities redeem shares, the underlying BTC often moves to liquid venues for execution. This creates a localized supply shock that tests the current bid depth.
Table 1: Institutional Flow Summary
| Metric | Reported Value | Primary Data Source |
|---|---|---|
| Trailing 14-Day ETF Outflows | ~$2.68 Billion | Farside Investors ETF Data |
| Net Exchange Inflows (7-Day) | Elevated / Net Positive | CryptoQuant |
| Exchange Bitcoin Reserves | Increasing | Glassnode |
| Spot Volume Support Floor | $70,000 | Velo Data |
Spot Market Dynamics: Are Dip Buyers Truly Dominant?
Reviewing the Aggregated Spot Cumulative Volume Delta allows us to measure the net difference between market buying and market selling volume. Given the sizable ETF selling and the documented BTC exchange inflows, the spot CVD data suggests current buyers are acting purely as shock absorbers.
Order book metrics show that current spot buying activity is sufficient to put a floor beneath the price. It is preventing a cascade below the psychological $70,000 level. Yet, it lacks the conviction required to reverse the broader downtrend established throughout late May. The buyers are curbing the sell-off, but they are not taking control of the market direction.
Table 2: Order Book and Spot Metrics
| Indicator | Current Status | Market Implication | Source |
|---|---|---|---|
| Aggregated Spot CVD | Flattening / Neutral | Passive absorption of sell pressure | Velo Data |
| Bid-Ask Ratio (10% Depth) | Slightly Positive | Limit bids outweigh limit asks | Hyblock Capital |
| Spot Market Order Flow | Below Average | Lack of aggressive upside conviction | Binance Orderbook Data |
Futures Market Vulnerabilities and Open Interest Heatmaps
The spot market provides the foundation, but the derivatives market dictates short-term volatility. An assessment of the futures landscape reveals a fragile equilibrium.
Reviewing the open interest heatmap data over a recent seven-day lookback period highlights a significant concentration of liquidity. Data indicates a $300 million open interest cluster sitting tightly within the $73,000 to $74,000 price band. This positioning suggests a large cohort of traders recently opened leveraged long positions, anticipating a rapid bounce from the lows. S&P 500 Today: Index Climbs to 7,563.62 as Market Extends Gains
This concentration of leveraged longs presents a distinct structural vulnerability. If the spot market fails to hold the $72,000 level and begins to drift lower, these long positions will fall underwater. The resulting automated liquidations would force the market to sell into an already weak order book. This action could easily drive prices down to test the heavily defended $70,000 support zone.
Table 3: Derivatives Market Heatmap Analysis
| Price Zone | Open Interest Concentration | Primary Data Source |
|---|---|---|
| $73,000 – $74,000 | Elevated Long Positioning (~$300M) | Hyblock Heatmap Data |
| $70,000 – $71,000 | Limit Bids / Put Selling Base | Deribit Options Data |
| $74,000 – $75,000 | Short Liquidation Cluster | CoinGlass |
Key Levels Traders Are Watching
Understanding where liquidity rests is critical for navigating this environment. Institutional trading algorithms and systematic funds base their execution parameters around specific technical thresholds. The table below outlines the current structural framework defining the Bitcoin market.
Table 4: Critical Price Thresholds
| Price Level | Market Importance | Expected Reaction |
|---|---|---|
| $76,000 | Bullish Breakout Zone | Confirmation of uptrend continuation |
| $75,000 | Major Resistance | High probability of short-selling pressure |
| $72,000 | Short-Term Support | Current battleground for spot dip buyers |
| $70,000 | Major Structural Support | Critical floor; break indicates severe weakness |
What Needs to Happen for Bitcoin to Turn Bullish Again?
A sustained breakout from the current consolidation range requires more than passive limit orders. Based on historical market structure, four specific data points must align for Bitcoin to confirm a true bullish reversal.
- ETF Inflows Return Positive: The persistent institutional selling must conclude. The market needs to log consecutive days of net positive capital flows into US spot Bitcoin ETFs to signal that institutional de-risking is over.
- Futures Funding Stabilizes: The open interest heavily weighted toward the long side near $73,000 needs to be flushed or neutralized. A reset in funding rates provides a healthier baseline for a sustainable upward move.
- Spot CVD Turns Positive: Passive limit orders must transition into aggressive market orders. A definitive shift in the Cumulative Volume Delta, showing that buyers are willing to cross the spread and pay higher prices, is mandatory.
- BTC Reclaims the $75,000 Resistance: From a technical perspective, clearing the short liquidation clusters sitting above $74,000 and firmly closing daily candles above the $75,000 resistance zone will signal a structural shift back to a bullish environment.
Frequently Asked Questions (FAQ)
Why is Bitcoin struggling to hold its recent highs?
The recent downward pressure is primarily driven by significant capital outflows from US spot Bitcoin ETFs. According to Farside Investors, approximately $2.68 billion exited these funds over a two-week period. This selling increases available supply on exchanges, overwhelming short-term retail demand.
What does weak spot volume mean for the price recovery?
Weak spot volume indicates that the current price stabilization is driven by a lack of sellers rather than strong buying pressure. Buyers are placing passive orders to catch the falling price, but they are not aggressively purchasing at market value to drive the price upward. This makes the current support levels fragile.
How do futures markets threaten the current $72,000 support level?
CoinGlass and Hyblock data show a high concentration of leveraged long positions around the $73,000 to $74,000 mark. If the spot price drifts lower, these traders face forced liquidations. This automated selling creates additional downward pressure, potentially driving the price toward the major $70,000 support floor.
What is the most important metric to watch for a market reversal?
Monitoring the Spot Cumulative Volume Delta (CVD) alongside daily ETF flow data is critical. A confirmed reversal requires ETF outflows to stop and spot CVD to turn positive, indicating that large entities are aggressively accumulating the asset again.
Evaluate Your Market Exposure
Navigating digital asset markets requires superior data and execution systems. Rely on verifiable market structures rather than social media sentiment. If you are assessing your portfolio exposure, carefully review the ETF flow data, spot CVD trends, and futures open interest levels detailed in this report before committing capital. Evaluate the underlying volume, track the institutional flows, and ensure your trading strategy aligns with actual order book mechanics. Click below to access our real-time tracking tools and monitor these critical support levels today.
Financial Disclaimer: The information provided in this article is for educational and informational purposes only and does not constitute financial, investment, or trading advice. Past performance is not indicative of future results. Always conduct independent due diligence or consult with a licensed financial advisor before making any investment decisions.