Bitcoin and software stocks show a historic divergence as analysts monitor potential crypto market shifts and institutional capital rotation.
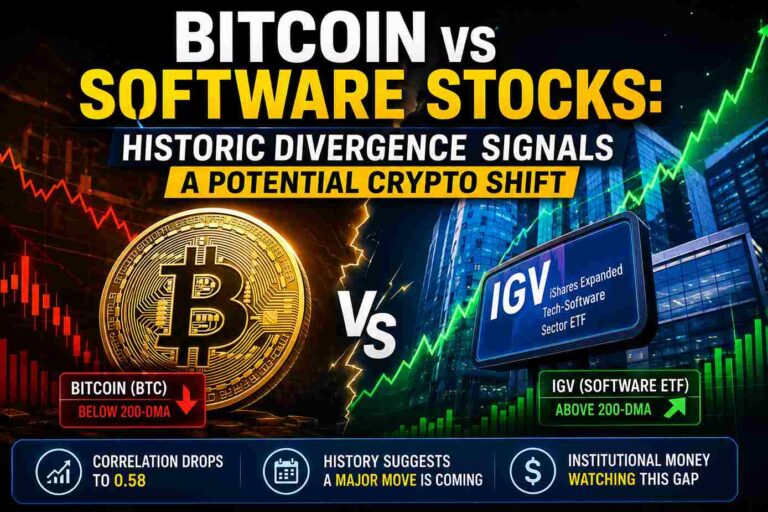
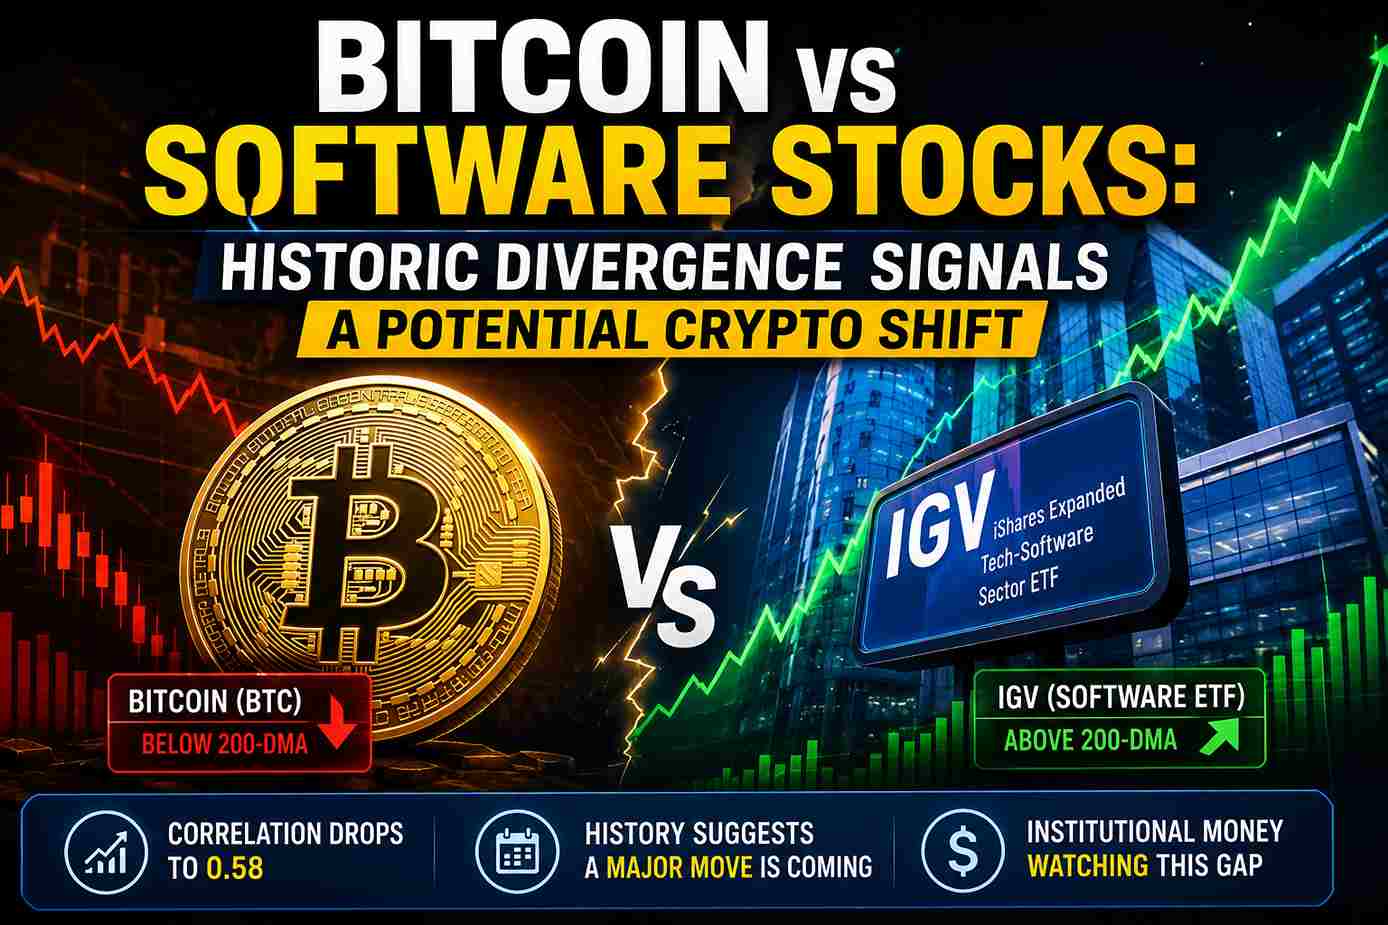
Bitcoin vs Software Stocks: Historic Divergence Signals a Potential Crypto Shift
For the better part of the last five years, professional portfolio managers have often treated Bitcoin not merely as an isolated digital asset, but as a high-beta technology proxy. If you wanted to evaluate where digital assets were heading, analyzing the broader software sector was a standard procedural step. But during recent market cycles, that relationship has shown signs of fracturing. The data is currently flashing an unusual market signal—one that structural analysts are watching closely.
According to recent market intelligence highlighted by CoinDesk, Bitcoin and software stocks—specifically benchmarked against the iShares Expanded Tech-Software Sector ETF (IGV)—are experiencing a notable decoupling. While the IGV has staged a powerful recovery since early April, reclaiming its 200-day moving average and defying the “SaaS growth slowdown” narratives, Bitcoin has lagged. The cryptocurrency has experienced consolidation, remaining below its own key long-term moving averages.
In my analysis, this divergence represents an anomalous window in cross-asset correlation. The 20-day rolling correlation between Bitcoin and the IGV has shifted significantly lower than its historical baseline, marking an unusual disconnect in recent market structures. From an institutional viewpoint, this indicates that Bitcoin may be entering a potential reversion setup if historical correlation patterns return, or that localized digital asset capital flows are temporarily overriding traditional risk-on macroeconomic factors.
The Mechanics of the Decoupling: Technical Indicators in Flux
To understand why this relationship has drifted, it is necessary to examine how institutional quantitative models manage risk allocation. When multi-asset managers hold positions in both traditional technology equities and spot Bitcoin ETFs, their risk-management systems categorize both assets within similar high-growth volatility frameworks.
Earlier in the year, traditional Software-as-a-Service (SaaS) companies faced intense downward valuation pressure as the market re-evaluated enterprise spending and the integration timeline of Artificial Intelligence. When software indices pulled back, institutional risk models automatically adjusted their overall growth-exposure parameters. Because the digital asset market operates 24/7 and boasts immediate liquidity, Bitcoin is often utilized by multi-strategy desks as an efficient tool to reduce overall portfolio risk quickly during broader equity drawdowns.
However, the software narrative has sharply pivoted. The IGV ETF has reclaimed significant ground, moving well back above its long-term structural baselines. Conversely, Bitcoin has remained inside a compressed trading range, creating a temporary gap between traditional tech equity momentum and digital asset capital flows.
NYDIG Analysis: Why the $1.3B IBIT Block Trade Signals a Major Bitcoin Whale Exit
Evaluating the 200-Day Moving Average Disconnect
In institutional trend analysis, the 200-day moving average (DMA) serves as a primary benchmark for long-term market bias. Assets trading cleanly above this line are generally viewed through an accumulation lens, while those trading below often face systematic selling pressure during short-term rallies.
Currently, cross-asset technicals display a stark contrast. The software sector has reclaimed this key psychological territory, shifting medium-term momentum indicators back toward a bullish bias. Meanwhile, Bitcoin has continued to trade below its 200-DMA baseline. This technical lag in the crypto market is frequently attributed to specific localized headwinds—including digital asset fund outflows and post-halving mining sector adjustments—even as macroeconomic tailwinds support broader technology equities.
Market Snapshot: Cross-Asset Structural Comparison
| Metric / Structural Status | Bitcoin (BTC) | IGV (Software ETF) |
|---|---|---|
| Recent Price Action Bias | Consolidating within localized ranges | Substantial rebound from early Q2 lows |
| 200-Day Moving Average Status | Trading below the 200-DMA threshold | Reclaimed and holding above the 200-DMA |
| Primary Structural Driver | Supply absorption and capital flows | Enterprise earnings and AI optimization |
| Risk Framework Category | High-Beta Global Liquidity Asset | Core Technology Growth Allocation |
Historical Context: Previous Cross-Asset Divergence Events
Data indicates that while Bitcoin and technology equities can decouple during brief windows of asset-specific stress, they historically realign over longer market cycles. Looking back at previous macro regimes clarifies how these divergences typically resolve.
During past phases of divergence, the gap has rarely sustained over multi-quarter periods without an overarching macro shift. The table below outlines how prior instances of separation resolved once broader liquidity conditions normalized.
Historical Precedents: Bitcoin and Tech Index Separations
| Year / Phase | Market Situation | Observed Resolution Pattern |
|---|---|---|
| 2020 Macro Shock | Initial liquidity divergence during global shutdowns | Bitcoin rapidly followed the tech sector’s aggressive recovery |
| 2022 Tightening Cycle | Intermittent decoupling during interest rate adjustments | Both asset classes ultimately declined in tandem to reflect the macro regime |
| 2024 Product Launch | Spot ETF inflows temporarily decoupled BTC from traditional tech pairs | Correlations normalized once early fund flows stabilized into a baseline trend |
This historical pattern suggests that the current gap between the IGV and Bitcoin is an anomaly that warrants close monitoring. If global liquidity conditions remain supportive of the broader software sector, institutional frameworks may eventually look to rotate capital back into lagging assets that share similar risk profiles.
Inside the Deal: Why Samsung Just Dropped $408 Million on a Crypto Exchange
Institutional Strategies: Navigating the Correlation Gap
Institutional desks often monitor such divergences as potential relative-value opportunities rather than a permanent structural breakdown. Rather than relying on emotional retail sentiment, professional capital allocations generally rely on systematic execution models.
- Relative-Value Rotation Analysis: Portfolio managers tracking cross-asset metrics frequently look for lagging components within identical risk buckets. If tech stocks remain resilient, strategies may involve taking profits from extended software names and reallocating capital to digital assets trading at a relative technical discount.
- Structured Options Exposure: Some institutional strategies may use options structures to gain asymmetric exposure to a potential catch-up trade. By utilizing call spreads or long-dated volatility contracts, desks can position for a sharp technical reversion without exposing spot portfolios to capital drawdowns if the equity market faces a sudden reversal.
- Monitoring Net Asset Fund Flows: The turning point for a correlation realignment is typically visible first in institutional vehicle flows. Analysts track daily net changes in major spot Bitcoin products, looking for consecutive accumulation sessions to signal that macro managers are actively re-engaging the asset.
The Mining Sector Variable: Post-Halving Economics
While software equities are primarily valued based on enterprise subscription renewals, net margins, and forward guidance, Bitcoin maintains an entirely different internal supply mechanism. The recent underperformance of digital assets relative to equities coincides directly with the structural shifts following the latest halving event.
The reduction in block rewards inherently strains the profit margins of global mining operations. When network difficulty remains elevated and hardware costs rise, less efficient mining operations frequently capitulate, liquidating portions of their digital asset treasuries to fund ongoing capital expenditures. This creates a localized, physical supply headwind that traditional software equities do not experience. Historically, once the network hash rate stabilizes and inefficient operations complete their restructuring cycles, this persistent localized selling pressure tends to diminish, allowing the asset to reconnect with broader macroeconomic risk-on trends.
FAQ: Analyzing the Tech Equity and Digital Asset Relationship
| Market Inquiry | Analytical Assessment |
|---|---|
| Why is the IGV ETF considered relevant to Bitcoin’s outlook? | The IGV serves as a benchmark for high-growth software and tech-related names. Because institutional capital pools often classify both software and Bitcoin under the same high-beta risk umbrella, their long-term directional trends have frequently aligned. |
| What factors are driving the current divergence? | The software sector has been supported by robust corporate earnings and AI integration progress, while Bitcoin has faced asset-specific pressures such as post-halving miner adjustments and fluctuating spot product inflows. |
| How do correlation metrics usually behave in these setups? | Historically, this relationship has often been stronger during risk-asset cycles. When the correlation dips significantly below historical averages, it typically indicates a short-term inefficiency that resolves through cross-asset capital rotation. |
| Does this divergence suggest software is overvalued or crypto is undervalued? | It indicates a disparity in momentum. If the equity market’s recovery proves sustainable, macro frameworks suggest that the lagging asset, Bitcoin, could experience an upward reversion to realign with the broader tech complex. |
Final Analyst Perspective: Contextualizing the Market Setup
Operating successfully within institutional markets requires a disciplined, data-first approach. The current decoupling between Bitcoin and the IGV should not be viewed as a definitive sign of structural failure for either asset class. Instead, it highlights an environment where localized supply factors have temporarily obscured broader macroeconomic correlations. Quantitative models are fundamentally asset-agnostic; they look for liquidity, volatility, and relative value.
The institutional data points to a clear trend: the appetite for high-duration growth assets is active in the traditional equity space. While Bitcoin remains in a lower technical consolidation phase, it presents a distinct profile for relative-value analysis. Relying on technical confirmation after an asset reclaims major thresholds like the 200-day moving average is a standard conservative method, but observing the underlying cross-asset divergence before the gap closes is how institutional desks structure their forward-looking risk models.
Monitoring the relationship between global technology benchmarks and digital asset capital flows remains a critical procedural method for identifying macro shifts before they manifest in retail markets.
Track This Historic Correlation Gap
Are you monitoring the shifting dynamics between traditional technology equity trends and digital asset capital flows? Staying ahead of institutional rotation patterns requires institutional-grade data. Subscribe to our comprehensive market intelligence newsletter to receive daily flow tracking, technical baseline audits, and deep-dive macroeconomic asset reports designed for professional market participants.
Disclaimer: This article is presented strictly for informational and educational purposes and does not constitute financial, investment, legal, or tax advice. Cryptocurrency and equity markets involve substantial risk, including the possible loss of principal capital. All data, historical comparisons, and structural analyses represent professional observations and are not a guarantee of future market outcomes. Investors must perform their own independent due diligence and consult with a licensed financial professional before making asset allocations or deploying capital.