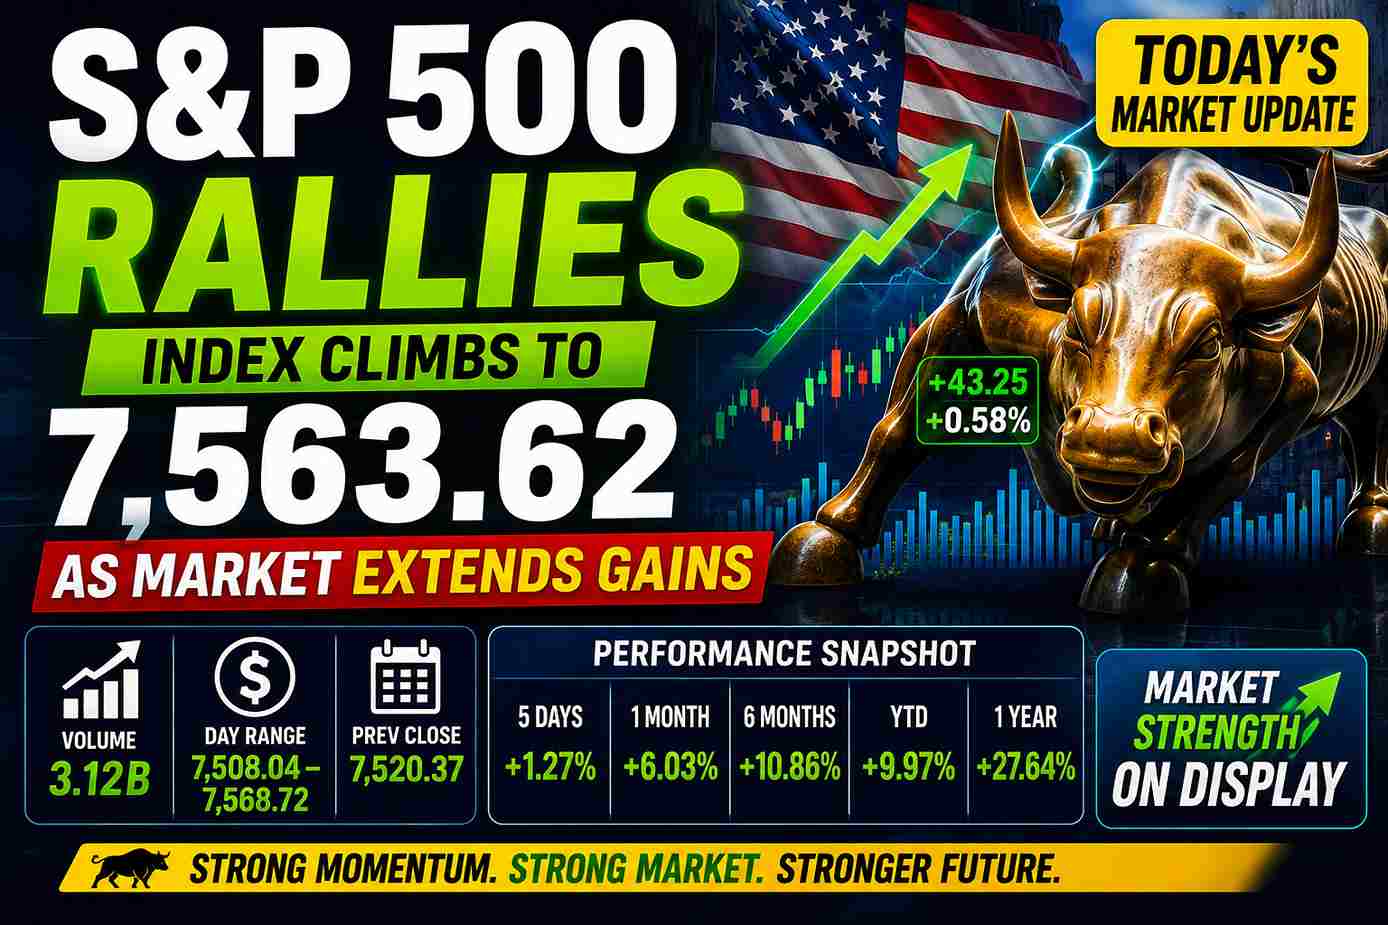
The S&P 500 closed at 7,563.62, gaining 43.25 points (+0.58%) as market momentum remained strong and investors pushed equities higher.
Short News Summary
Monitoring the S&P 500 Today reveals a continued pattern of upward market momentum, as broad equities ended the latest trading session in positive territory. Based entirely on the most recent market metrics visible on the TradingView platform, the benchmark index closed at 7,563.62. This represents a solid single-day advance of 43.25 points, equating to a 0.58% gain from the previous close. The session was characterized by steady buying interest, with total trading volume holding at 3.12 billion units as market participation remained active through the closing bell.
This daily performance fits into a much wider picture of sustained market growth that has taken shape over the past several months. The short-term and intermediate charts highlight an ongoing upward progression, steering clear of severe pullbacks. With a five-day advance of 1.27% and a robust one-month gain of 6.03%, the available data indicates that investors are maintaining a confident posture. Buying activity has consistently absorbed available supply, allowing the index to push past previous resistance levels and establish higher baselines across multiple timeframes.
Key Market Snapshot
The latest intraday session delivered a highly constructive outcome for the broader equity market. Reviewing the real-time charting data sourced directly from the TradingView platform, the index established firm support early in the session and pushed steadily toward the upper boundaries of its daily threshold. The final print settled at exactly 7,563.62, reflecting a net daily change of +43.25 points. This translates into a 0.58% upward move from the prior baseline, underscoring active and consistent market participation from the opening bell to the close.
Trading activity was highly visible throughout the session, with total tracking volume reaching 3.12 billion. The trading range for the day showed an orderly progression between a session low of 7,508.04 and an intraday high of 7,568.72. This relatively tight yet ascending range demonstrates that buyers remained in control, consistently lifting their offer prices. The index opened at 7,519.82, which was just slightly below the previous close of 7,520.37, but quickly found its footing to drive higher throughout the day’s standard trading hours.
| S&P 500 Today: Core Session Metrics | Data Value |
|---|---|
| Current Closed Index Level | 7,563.62 USD |
| Net Point Change | +43.25 Points |
| Percentage Change | +0.58% |
| Previous Market Close | 7,520.37 USD |
| Session Opening Print | 7,519.82 USD |
| Intraday Low Boundary | 7,508.04 USD |
| Intraday High Boundary | 7,568.72 USD |
| Trading Session Volume | 3.12 Billion Units |
S&P 500 Performance Snapshot
To fully grasp the current trajectory of the market, it is essential to look beyond the single-day timeframe. The TradingView dashboard provides a clear breakdown of the index’s returns across multiple specific rolling periods. This broader view confirms that the latest daily gain is part of a much larger, sustained upward cycle. The data shows no severe long-term deterioration, but rather a sequence of compounding advances.
The table below outlines the exact percentage returns across the standard performance windows. These metrics highlight how the index has accumulated value over the short, medium, and long term. The transition from a 1.27% gain over five days to a massive 27.64% surge over a full year illustrates the persistence of the current market expansion phase.
| Performance Period | Percentage Return |
|---|---|
| 1 Day | +0.58% |
| 5 Days | +1.27% |
| 1 Month | +6.03% |
| 6 Months | +10.86% |
| Year to Date (YTD) | +9.97% |
| 1 Year | +27.64% |
What the 5-Day Trend Reveals
A closer look at the rolling five-day chart indicates an accelerating momentum profile. The short-term trend line shows a series of ascending micro-support levels, with the index accumulating a net gain of 1.27% over the multi-session period. This short-term expansion has allowed the index to clear minor technical barriers, transforming prior resistance levels into active technical floors. The visual representation on the TradingView chart shows a steady climb that has successfully maintained higher lows.
The direction of this five-day trend suggests a measured, calculated wave of buying interest rather than a highly volatile speculative spike. Market sentiment appears fundamentally grounded in price stability, as evidenced by the lack of wild, uncoordinated downward gaps over the course of the week. Instead, the chart structure reveals an orderly stair-step pattern that typically points to sustained market participation over a multi-day execution window.
One-Month Performance Analysis
The intermediate-term chart structure provides even greater clarity regarding the current strength of this market rally. Over the past one-month lookback period, the broad-market index has posted a robust return of 6.03%. This level of performance indicates that capital is not merely dipping into the market for quick intraday trades, but is actively establishing and holding longer-term equity positions. A 6% move in a 30-day window for a major capitalized index requires substantial and consistent buying volume.
Investor behavior during the past month reveals consistent dip-buying activity whenever the index approached its short-term moving baselines. Market participation has kept the trend trajectory elevated, allowing the broader index to experience comprehensive appreciation. This persistent trend strength effectively confirms that equity demand continues to outweigh supply, keeping the overall market structure tilted heavily to the upside.
Six-Month Chart Signals
Evaluating the longer-term technical structure through the six-month chart window reveals a powerful recovery and expansion cycle. The data indicates that the index has gained 10.86% over the trailing six-month period. The visual chart on TradingView shows a distinct dip occurring earlier in the timeframe, where the index dropped significantly before embarking on its current structural advance. After establishing a local bottom, the index staged a highly effective recovery.
This robust technical recovery signals broad market resilience. Market participants appear to have utilized the local price discount during that earlier dip to aggressively accumulate core equity holdings. This accumulation created a rock-solid structural foundation, allowing the market to reclaim its upward trajectory and push to its current level near 7,563. The continuous upward curve clearly visible from the middle of the chart to the present day underscores the systemic nature of this market rally.
Seasonal Performance and Historical Context
The historical seasonal performance metrics visible on the TradingView platform provide critical context for the current market run. When evaluating the multi-year tracking lines on the “Seasonals” tab, the index’s current path shows unique characteristics. Historically, certain months can introduce notable seasonal headwinds, with historical paths like 2022 displaying steep downturns (dropping near -19.95% on the chart) that wiped out significant percentages of equity value.
However, the current tracking lines stand out for their resilience. Currently sitting at a year-to-date return of 9.97% on the main overview, the market is severely outperforming the more bearish historical tendencies. While historical trajectories sometimes experience a mid-year lull or a consolidation phase, the current structure has broken sharply upward. It is tracking much more closely with the highly positive historical templates established during previous expansion years, showing no immediate signs of bending to negative seasonal pressures.
What’s Driving the S&P 500 Higher?
An objective evaluation of the market’s technical architecture reveals that sustained market momentum is the primary driver of the current appreciation. The capitalization-weighted nature of the index means that steady buying interest across dominant sectors instantly elevates the baseline value of the entire benchmark. The consistent 3.12 billion session volume indicates that available market supply is being systematically absorbed without forcing the price down.
Furthermore, the data points to strong daily equity demand as a core structural driver. The fact that the index spent most of the day trading within the upper boundary of its 7,508.04 to 7,568.72 range proves that liquidity providers are continuously lifting their offer prices. The market opened lower than the previous close but immediately reversed course, which is a classic visual signal of active buying interest supporting the market at the first sign of a minor discount.
What Investors Are Watching Next
As the index positions itself at 7,563.62, technical market participants are shifting their focus to the next set of structural milestones visible on the chart. The immediate intraday resistance zone is clearly marked by the recent session high of 7,568.72. A clean, high-volume break above this level would signal that the current leg of the rally has enough buying interest to continue its upward slope into new technical territory.
Conversely, on the downside, traders are keeping a close eye on the previous close baseline of 7,520.37 and the session low of 7,508.04. These levels will serve as the initial line of defense against any short-term profit-taking. Market participation metrics, specifically the daily volume remaining near the 3 billion mark, will be necessary to validate the stability of the current price structure over the coming trading sessions.
Key Takeaways for Investors
- The broad market index concluded its latest trading session at 7,563.62, securing a net daily gain of 0.58%.
- Short-term momentum remains visibly positive, with a 5-day advance of 1.27% building an ascending technical floor on the chart.
- Intermediate trend strength is exceptionally robust, supported by a 1-month gain of 6.03% and a 6-month surge of 10.86%.
- The current year-to-date return stands at 9.97%, showing strong market participation that defies negative historical seasonal trends.
- Trading volume held steady at 3.12 billion units, confirming that active buyer interest is currently supporting the upward price structure.
FAQ Section
Why is the S&P 500 rising today?
Based on the latest TradingView market data, the index is rising due to steady market participation and active buying interest, which pushed the price up 0.58% to close at 7,563.62. This upward movement was backed by a solid trading volume of 3.12 billion units, showing that buyer demand comfortably absorbed seller supply throughout the daily session.
Is the S&P 500 near a record high?
The available TradingView data shows the index trading near the upper end of its recent range. With a trailing 1-year return of 27.64% and a year-to-date return of 9.97%, the visual charts confirm that the index has consistently broken past previous resistance lines to establish higher baselines over the past twelve months.
What does the current trend mean for investors?
The current data layout indicates a highly coordinated, multi-month structural advance rather than a short-term speculative spike. The 6-month gain of 10.86% and the 1-month advance of 6.03% suggest that investors are consistently allocating capital into equities, reinforcing a stable long-term trend line.
What is the significance of the recent volume data?
The session recorded a total trading volume of 3.12 billion units. In technical analysis, steady volume accompanying an increase in price indicates high-quality market participation. It proves that a wide base of buyers is actively backing the move, providing a structural floor for the asset class.
What should investors monitor next?
Investors should closely monitor the immediate resistance boundary established at the daily high of 7,568.72. On the downside, maintaining support above the previous close of 7,520.37 and the daily low of 7,508.04 is essential for keeping the short-term bullish technical narrative intact.
Conclusion
In summary, the objective technical metrics sourced directly from the TradingView platform indicate a highly stabilized upward trend across the broad US equity market. Monitoring the S&P 500 Today reveals that the benchmark index wrapped up its trading session at 7,563.62, logging a consistent daily advance of 0.58% while maintaining an orderly trading corridor. This single-day performance fits seamlessly into a much larger puzzle of structural growth, marked by an impressive 6.03% one-month advance and a solid 10.86% six-month accumulation cycle.
While historical seasonal templates suggest that certain times of the year can introduce market consolidation, the current market structure continues to demonstrate strong upward momentum. Supported by a healthy daily trading volume of 3.12 billion units, the price action remains structurally sound. The available data demonstrates that the index has built a resilient technical foundation, maintaining its multi-period progression as market participation remains active and engaged.
Financial Disclaimer
This article is prepared strictly for informational, educational, and journalistic purposes based entirely on historical and real-time data visible on the TradingView platform. It does not constitute financial advice, investment recommendations, legal counsel, or an endorsement to buy, sell, or hold any security, index, or financial derivative product. The equity markets involve substantial inherent risks, and past performance metrics do not serve as a reliable indicator or guarantee of future market results.
All figures, percentages, indices levels, and chart observations mentioned throughout this analysis are taken directly from the provided source material and are current as of the documented trading session. Retail and corporate investors must always conduct their own independent research, perform comprehensive risk assessments, and consult with a licensed, certified financial professional before executing any market strategy or capital allocation plan. The author holds no personal or financial positions in the index or associated financial instruments discussed in this publication.