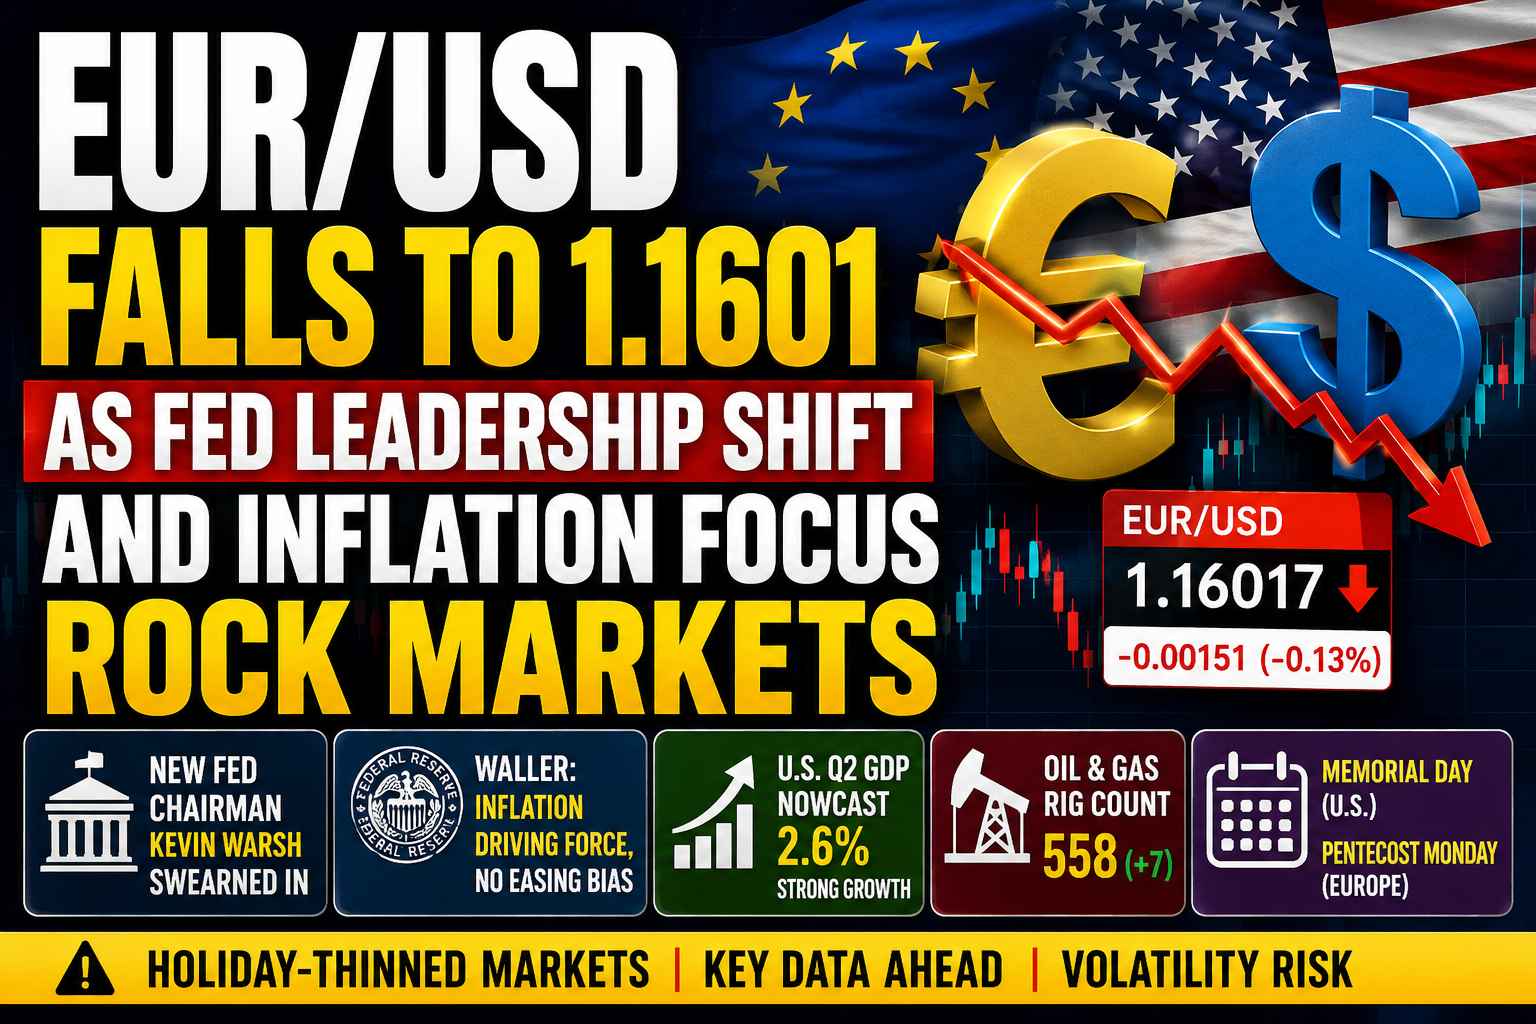
The EUR/USD trades lower near 1.1601 as markets assess Kevin Warsh's appointment as Federal Reserve Chairman, hawkish inflation commentary from Fed officials, and fresh U.S. economic data.
EUR/USD Market Update: Euro Trades Lower Amid Federal Reserve Leadership Transition and Macro Data
The Euro to U.S. Dollar (EUR/USD) exchange rate is currently navigating a news-heavy trading session dominated by major central bank transitions and regional economic data. As the most widely traded currency pair in the global forex market, the EUR/USD acts as the primary financial gauge measuring the economic relationship between the United States and the Eurozone. Today, that gauge reflects a market intensely focused on shifting monetary policy narratives in Washington and Frankfurt.
Forex market participants are currently processing a barrage of high-profile headlines. The formal swearing-in of a new Federal Reserve Chairman has brought U.S. monetary policy to the forefront of the financial news cycle. This leadership transition is accompanied by a series of statements regarding inflation, interest rate policies, and geopolitical developments. Concurrently, technical data reflects a market reacting to these fundamental catalysts, with the Euro trading lower against the U.S. Dollar on an intraday basis as traders monitor upcoming holiday-thinned liquidity conditions and regional economic releases.
1. Why EUR/USD Is Drawing Market Attention Today
The EUR/USD is drawing significant attention from institutional and retail traders today due to the sheer volume of macroeconomic news hitting the wires. In the foreign exchange market, currency valuations are fundamentally tethered to interest rate differentials and economic growth metrics. The current downward movement in the Euro relative to the U.S. Dollar coincides exactly with headlines that highlight U.S. economic resilience and strict central bank messaging regarding inflation.
When financial news platforms broadcast statements from Federal Reserve officials emphasizing that inflation remains the primary policy driver, forex traders take immediate notice. Currency markets operate on the principle that higher interest rates—or the prolonged maintenance of elevated rates—attract global capital seeking higher yields. This capital flow fundamentally supports the domestic currency. The current news environment features prominent Fed voices explicitly arguing against immediate monetary easing. Traders are weighing these firm policy stances against a backdrop of technical data that registers predominantly as a “Sell” across major market indicators, aligning the fundamental news flow with the visible market structure.
2. Current EUR/USD Price Action
A review of the intraday price action provides a factual record of how the market is behaving amid the current news cycle. At the time of the latest update, the EUR/USD pair is trading at 1.16017. This value represents a daily decline of 0.00151 points, which translates to a percentage drop of -0.13%.
The trading session opened at 1.16168, a figure that exactly mirrors the previous day’s closing price. Throughout the current session, the currency pair has traded within a specific parameters, reaching an intraday high of 1.16205 before declining to a daily low of 1.15882. The trading volume recorded for this period stands at 135.19K.
For market observers, this intraday range demonstrates that the pair has remained confined below its opening level for the majority of the session. The inability of the exchange rate to post sustained trades above the 1.16168 open indicates that selling volume has outpaced buying volume during this specific window, pushing the valuation toward the lower boundary of the day’s established range.
3. Federal Reserve Headlines Take Center Stage
The primary catalyst for trader attention this session is the extraordinary volume of Federal Reserve headlines crossing the news feeds. Changes in central bank leadership are hallmark events in the financial world, as the Federal Reserve ultimately dictates the supply and cost of the U.S. Dollar.
Visible headlines confirm the swearing-in ceremony of Kevin Warsh as the new Chairman of the Federal Reserve. According to the reports, Warsh pledged a “Reform Oriented Federal Reserve,” calling the appointment the “honor of a lifetime to be called back to public service.
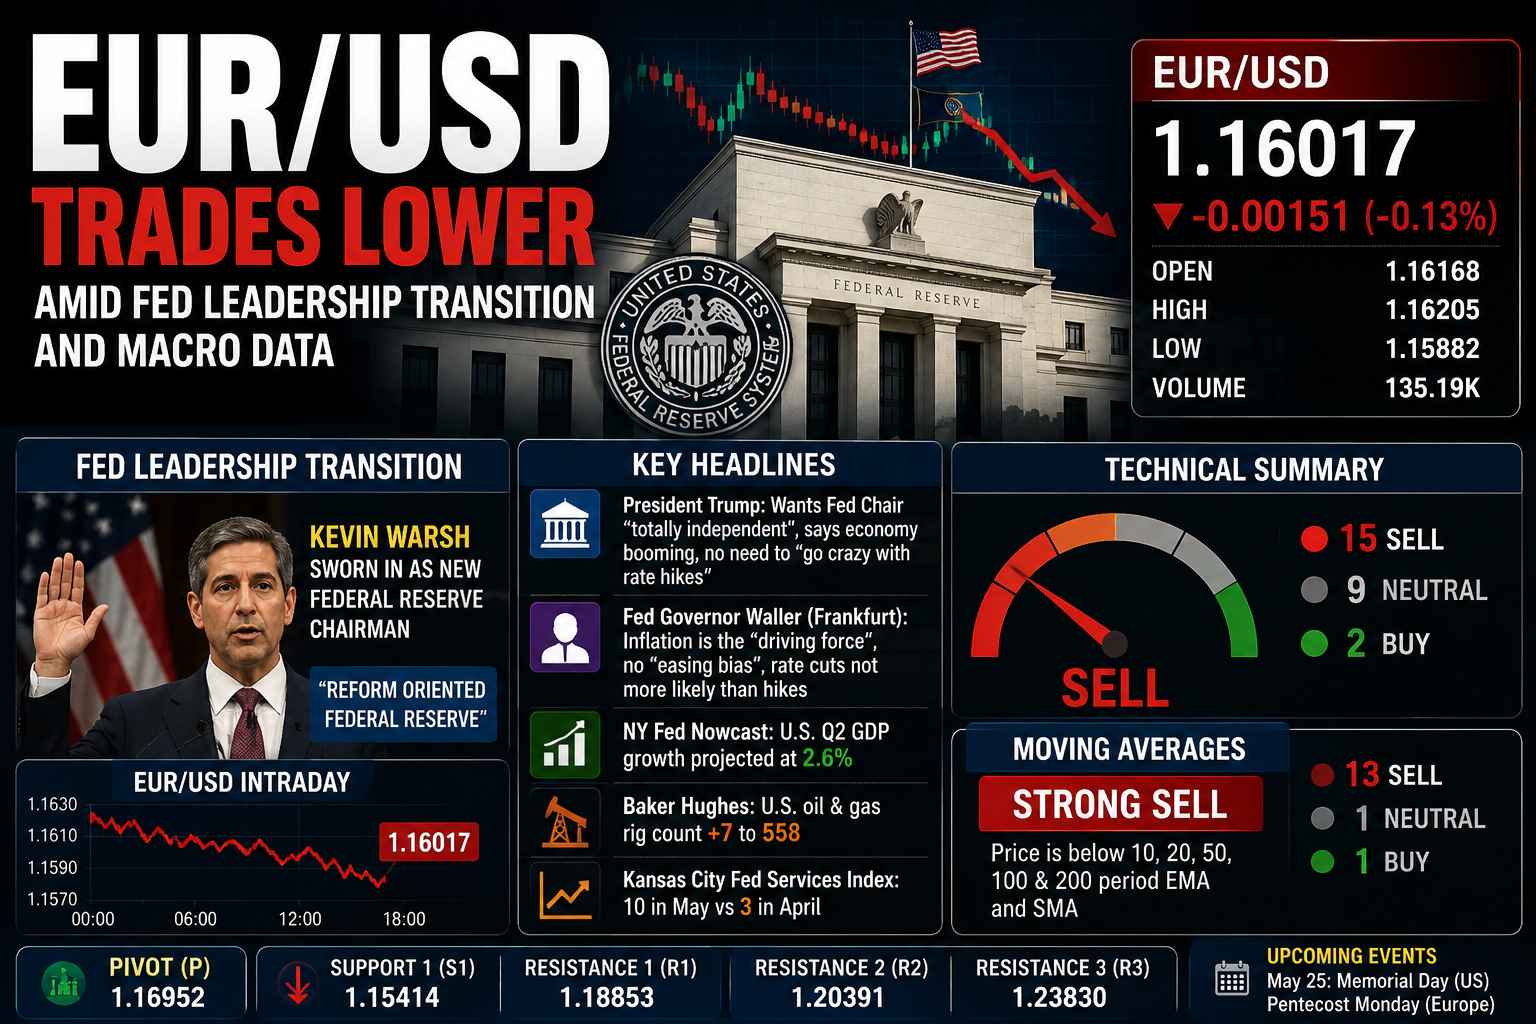
The ceremony generated significant commentary from President Trump, who was in attendance. Headlines report the President stating, “Ours is a time of great consequence,” and noting that he wants the new Fed Chair to be “totally independent.” However, the President also offered direct commentary on macroeconomic policy, stating that when the economy is booming, officials don’t “have to go crazy with rate hikes.” He further highlighted that U.S. stocks are again at record levels and touched upon foreign policy, stating that “Iran is dying to make a deal but can never have nukes,” while mentioning a record number of regulation cuts.
Traders monitor these statements closely because political desires for economic growth often contrast with a central bank’s mandate to control inflation. This contrast was immediately visible in the news feed via comments from Federal Reserve Governor Waller, speaking from Frankfurt.
Waller provided a strictly policy-focused perspective, stating that he does not “expect to support a change to the policy rate near term.” He acknowledged that the jobs market has “stabilized,” but firmly reiterated that “inflation [is] the driving force.” In a direct message to the markets, Waller emphasized a desire to remove any “easing bias” to make it clear that a rate cut is no more likely than a rate increase. Furthermore, he noted that the central bank “can no longer rule out rate hikes further down the road” and argued that markets are currently underpricing the risk of prolonged high energy prices. For forex traders, this messaging confirms that the central bank remains intensely focused on restrictive monetary policy, a factor that traditionally supports the U.S. Dollar.
4. Macroeconomic Data Highlights U.S. Resilience
Supporting the Federal Reserve’s policy stance is a series of macroeconomic data points that highlight ongoing resilience within the United States economy. Financial journalists and forex traders track these metrics because they provide the empirical data that central bankers use to make interest rate decisions.
The latest headlines feature the U.S. NY Fed Nowcast, which currently pegs the U.S. Q2 GDP growth rate at 2.6%. The report notes that this figure remains unchanged after the week’s economic reports, as strong housing starts offset a weak Philly Fed reading. A GDP growth rate of 2.6% indicates a robust, expanding economy, which gives the Federal Reserve the flexibility to maintain higher interest rates without immediately triggering a recession.
Additionally, regional economic activity shows signs of expansion. The U.S. Kansas City Fed Services Business Activity Index registered a reading of 10 in May. This marks a notable increase from a reading of 3 in April and follows a reading of 15 in March.
In the energy sector—which ties directly back to Governor Waller’s comments regarding the underpriced risk of high energy prices—the latest U.S. Baker Hughes oil and gas rig count showed an increase of 7 rigs from the previous week, bringing the total active count to 558 rigs. Energy prices are a primary component of inflation data, and traders monitor rig counts as a leading indicator of energy sector activity.
Treasury Yields Spook Crypto: $550M Wiped in Overnight Market Correction
5. Technical Indicators Reflect the Fundamental Backdrop
While macroeconomic news and central bank policy dictate the broader market narrative, technical indicators provide traders with a mathematical snapshot of current market momentum. The visible technical data for the EUR/USD pair aligns closely with the fundamental news flow, reflecting the current downward price action.
The overall Technical Summary gauge on the platform displays a “Sell” reading. This summary is aggregated from a total of 15 Sell signals, 9 Neutral signals, and 2 Buy signals. When broken down into specific categories, the Moving Averages suite displays a “Strong Sell” rating, consisting of 13 explicit Sell signals, 1 Neutral, and 1 Buy.
Moving averages are trend-following indicators that smooth out historical price data. The data shows that the current price of 1.16017 is situated below the widely monitored 10-period, 20-period, 50-period, 100-period, and 200-period Exponential and Simple Moving Averages. Conversely, the Oscillators gauge—which measures the speed and change of price movements—displays an overall “Neutral” rating, comprising 2 Sell, 8 Neutral, and 1 Buy signal. Traders observe these indicators as a mathematical confirmation of the price action documented earlier in the session.
6. Key Pivot Levels Being Monitored
In addition to moving averages, day traders and technical analysts monitor pivot points to identify mathematical boundaries where intraday price action is historically observed. Pivot points are calculated using the high, low, and closing prices of previous trading sessions.
According to the Classic pivot calculation method displayed in the data, the primary Pivot (P) level is mathematically set at 1.16952. Because the current trading price (1.16017) is below this primary pivot, the focal point shifts to the support levels calculated below the current price. The first level of support, designated as Support 1 (S1), is located at 1.15414.
Traders monitor these specific numbers on their charts to gauge the magnitude of the day’s price movement. The distance between the current price and these mathematically derived levels provides a framework for understanding the day’s trading range relative to recent historical volatility.
7. Economic Calendar: Holidays and Upcoming Data
The economic calendar is a critical tool for forex traders, providing a schedule of upcoming data releases and market events that introduce liquidity changes and volatility to the currency pairs.
The immediate calendar highlights a significant structural event for the global markets: the May 25 international bank holidays. The schedule notes that the United States observes Memorial Day, while a large portion of Europe—including Austria, Belgium, France, Germany, Luxembourg, Netherlands, and Switzerland—observes Pentecost Monday. Bank holidays result in the closure of major financial institutions in those regions, which drastically reduces global trading volume. Traders carefully monitor holiday schedules because low liquidity environments can occasionally result in erratic price movements if unexpected news enters the market.
Outside of the holiday schedule, the calendar lists several regional data releases. On May 25, Finland reports Export Prices YoY, Import Prices YoY, and PPI YoY. Slovenia will release its Business Confidence index, and France is scheduled to conduct 12-Month, 3-Month, and 6-Month BTF Auctions.
On May 26, the calendar features Ireland’s Consumer Confidence and Average Weekly Earnings, Spain’s PPI YoY, and several bond auctions from Italy and Austria. In the U.S. session, the Chicago Fed National Activity Index is scheduled for release, showing a prior reading of -0.2. Traders track these regional inflation metrics (PPI) and bond auctions to measure economic health across the Eurozone.
8. Historical Performance Snapshot
To provide context for the current day’s price action, traders review the historical performance metrics of the EUR/USD. The platform displays a categorized breakdown of performance percentages across multiple time horizons.
| Timeframe | Performance Value |
|---|---|
| 1 Day | -0.13% |
| 5 Days | -0.14% |
| 1 Month | -0.88% |
| 6 Months | 0.64% |
| Year to Date (YTD) | -1.16% |
| 1 Year | 2.87% |
| 5 Years | -5.11% |
| 10 Years | 4.15% |
These metrics demonstrate that while the 1-Year performance remains positive at 2.87%, the Year-to-Date figure currently registers a decline of -1.16%. Additionally, the historical seasonality chart displays the asset’s year-end performance figures based on past data, noting values of -1.00% for 2026, 14.40% for 2025, -5.34% for 2024, 3.49% for 2023, -5.27% for 2022, and -6.99% for 2021.
9. What Retail Traders Are Saying
The platform’s community forum features public commentary from retail market participants observing the current data and news flow. These statements provide a record of how individual traders are processing the visible market information.
Traders are actively discussing the macroeconomic headlines. User xauusdnadaqdxy commented on the political news, writing, “Trump says US in ‘final stages’ of talks with Iran – Any headlines he makes shouldn’t be able to move the market.” Observing recent price volatility, user imjustagirl noted, “and the whole move just erased…”
Others focus on the technical chart data. User HAMED_AZ offered a technical observation, stating, “Hello Traders! 👋 What are your thoughts on EURUSD? Analyzing EURUSD on the daily chart, the overall market structure suggests that sellers currently have the upper hand,…” Meanwhile, user mkkjamz68 expressed general sentiment, posting, “Who is ready for a great week hopefully. lets make some money ladies and gentleman.”
10. Market Summary Based on Visible Data
The visible data for the EUR/USD presents a factual record of a currency pair processing significant fundamental news against a backdrop of negative short-term technical indicators. The current price of 1.16017 resides below the session’s opening level, accompanied by moving average indicators that heavily register as a “Sell.”
This technical data aligns with a robust news cycle dominated by the United States. A new Federal Reserve Chairman has taken office, the NY Fed Nowcast models a 2.6% GDP growth rate for Q2, and Federal Reserve Governor Waller has publicly reiterated the central bank’s focus on inflation while arguing against an “easing bias.” The market operates within this framework of resilient U.S. economic data and strict central bank messaging as it approaches a holiday-thinned trading schedule affecting both North America and Europe.
11. Frequently Asked Questions
What is the current price and daily change for the EUR/USD?
The current price for the EUR/USD is 1.16017, which represents a daily change of -0.00151, or -0.13%.
Who was recently sworn in as the Chairman of the Federal Reserve?
According to the visible news headlines, Kevin Warsh was sworn in as the new Federal Reserve Chairman.
What did Fed Governor Waller state regarding inflation and interest rates?
Fed Governor Waller stated that inflation is the “driving force” and that he does not expect to support a change to the policy rate in the near term. He also emphasized a desire to remove any “easing bias.”
What does the NY Fed Nowcast project for U.S. Q2 GDP?
The US NY Fed Nowcast currently projects the U.S. Q2 GDP growth rate at 2.6%, remaining unchanged after the week’s economic reports.
What action does the Moving Averages summary display?
The Moving Averages summary displays a “Strong Sell” rating, which is derived from 13 explicit Sell indicators, 1 Neutral indicator, and 1 Buy indicator.
What is the Classic Support 1 (S1) pivot level currently shown?
The visible data for the Classic calculation method shows the Support 1 (S1) pivot level at 1.15414.
Which major holidays are noted on the economic calendar for May 25?
The economic calendar notes Memorial Day in the United States and Pentecost Monday across several European nations (including France, Germany, and Switzerland) on May 25.
What was the recent reading for the U.S. Kansas City Fed Services index?
The U.S. Kansas City Fed Services Business Activity Index registered a reading of 10 in May, compared to 3 in April.
How many active oil and gas rigs were reported by Baker Hughes?
The U.S. Baker Hughes oil and gas rig count showed an increase of 7 rigs from the previous week, bringing the total to 558 rigs.
What is the Year-to-Date (YTD) performance for the EUR/USD?
The visible Year-to-Date (YTD) performance metric for the EUR/USD is currently -1.16%.
12. Conclusion
The EUR/USD market is currently characterized by a convergence of high-impact central bank headlines and resilient U.S. macroeconomic data. With the pair trading lower on the day at 1.16017, the market is processing the formal transition of Federal Reserve leadership alongside explicit statements from policymakers prioritizing inflation management. The visible technical data, highlighted by a suite of moving averages registering as a “Strong Sell,” reflects the downward price action documented during the session. As the market transitions into the May 25 international holiday schedule, participants continue to monitor these fundamental and technical data points to measure the ongoing economic relationship between the U.S. Dollar and the Euro.
Financial Disclaimer: This article is a factual news report derived strictly from visible market data, economic calendars, and news headlines provided in the financial terminal interface at the time of publication. It does not constitute independent financial advice, personal investment recommendations, or predictive market forecasting. Macroeconomic conditions, technical indicators, and news narratives are subject to rapid change. Always conduct independent due diligence and consult with a certified financial professional before executing any trades in the foreign exchange market.