Wall Street’s $109 Oil Shock: Why the Hormuz Crisis Just Broke the Soft Landing Narrative
Last Updated: May 16, 2026
Trading floors do not panic easily. They are built to absorb daily noise. But the price action that ripped through energy and equity markets this week was not just noise. It was a violent, structural repricing of global risk.
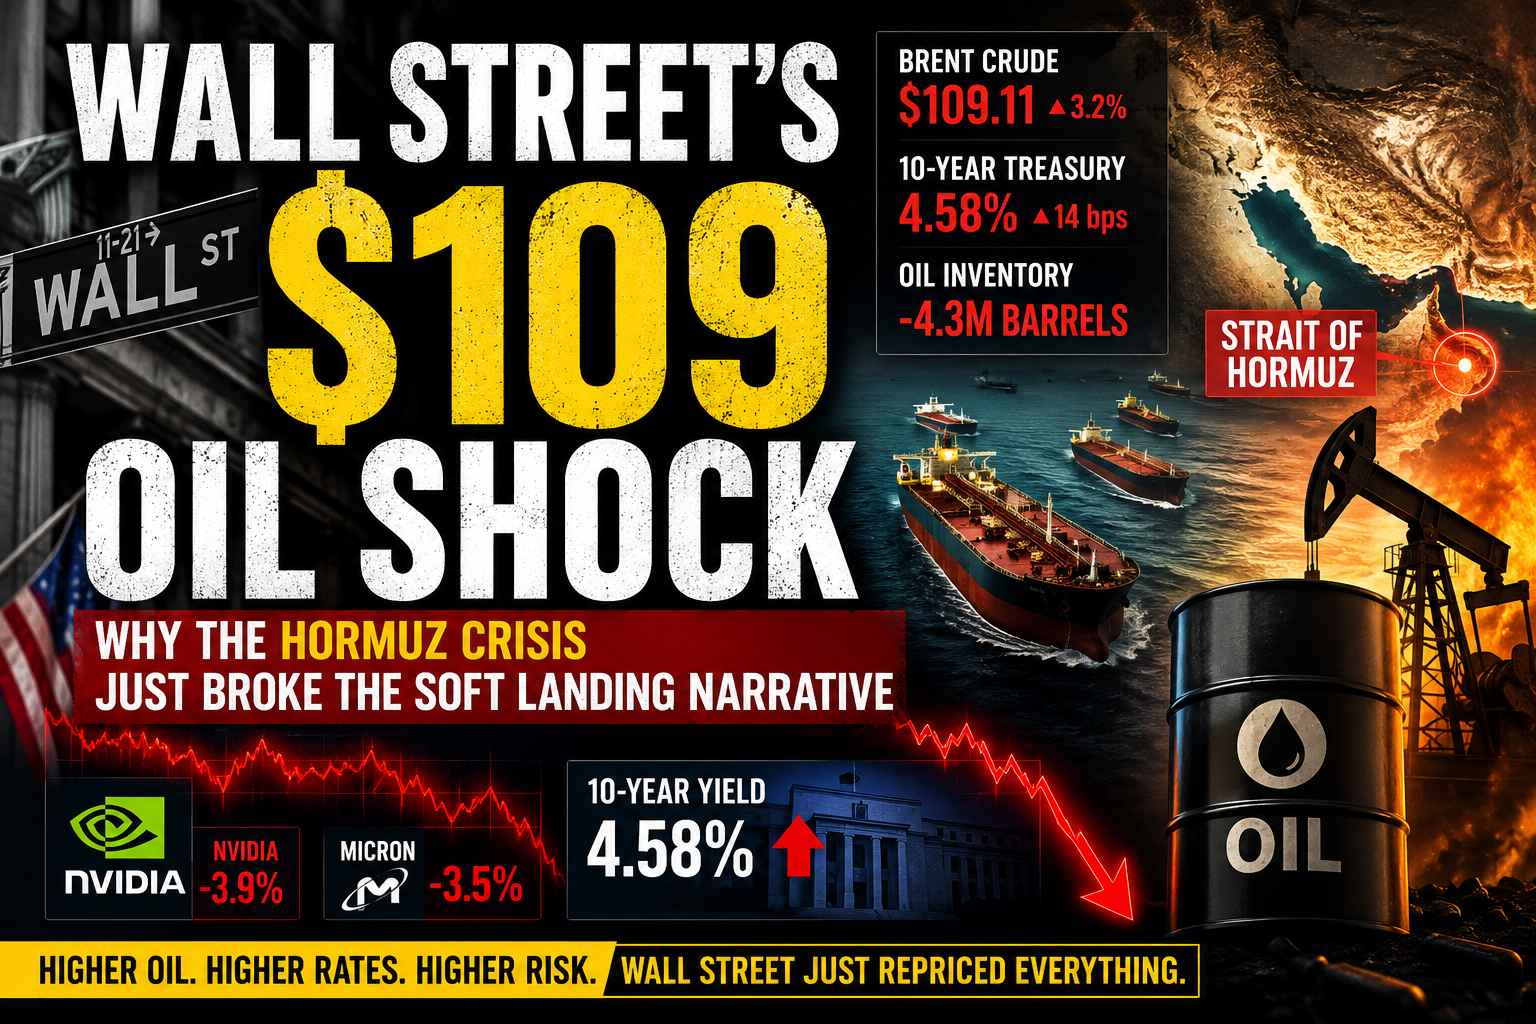
Overnight, Brent crude blew past $109 a barrel. By the time the opening bell rang in New York, the 10-year Treasury yield had spiked to an uncomfortable 4.58%. Heavy-hitting tech stocks came under immediate pressure.
What caused the sudden scramble? A harsh collision of physical supply threats and dashed diplomatic hopes.
The highly anticipated Trump-Xi summit in Beijing wrapped up with polite photo opportunities but very little concrete progress on trade tariffs or energy security. At the exact same time, tanker tracking data in the Strait of Hormuz showed a drastic slowdown. The world’s most sensitive energy chokepoint is facing mounting disruption.
For everyday investors, this is no longer just a geopolitical news story playing out on television. It is a serious repricing event across global markets. Wall Street is waking up to the reality that you cannot price the stock market for absolute perfection when the cost of energy is shooting through the roof.
The Diplomatic Safety Net Just Vanished
Money managers walked into this week looking for a pressure release. The consensus bet across Wall Street was that Washington and Beijing would signal some sort of back-channel stabilization. That would have allowed the risk-on equity rally to catch its breath.
Instead, the market got nothing.
Without a political buffer, traders on the desk were forced to look directly at the physical oil market. The data is incredibly tight. Loadings out of the Middle East have dropped far below historical averages of 20 million barrels a day. War-risk insurance premiums for vessels entering the Persian Gulf have tripled in just a few days. Freight rates to Asia are up over 250%.
When shipping companies start routing massive supertankers around the horn of Africa just to avoid the Middle East, it adds millions of dollars to a single voyage. Those costs do not simply disappear. They roll downhill, straight toward the consumer. For consumers, the impact may first show up in gasoline prices and airline fares before filtering into broader inflation data later this summer.
Market Snapshot (May 16, 2026)
| Asset / Metric | Latest Price | Market Impact |
|---|---|---|
| Brent Crude | $109.11 | Up 3.2% in one session. |
| WTI Crude | $105.76 | Gained over 4%. |
| 10-Year Treasury | 4.58% | Spiked 14 basis points. |
| US Oil Inventory | 452.9M Barrels | Dropped by 4.3M barrels. |
Why Silicon Valley Sold Off on Middle East Oil
If you look at the tape, companies like Nvidia and Micron do not buy millions of barrels of crude oil. So why did technology stocks lead the market selloff on Friday?
The answer comes down to the unforgiving math of stock valuations.
Growth and technology stocks are highly sensitive to interest rates. A massive chunk of their current stock price is based on the massive profits they are expected to generate years down the road. When inflation fears push the 10-year Treasury yield up to 4.58%, analysts discount the value of those future earnings.
Nvidia dropped nearly 4% on Friday. Micron fell more than 3.5%. This was not about a lack of demand for computer chips. It was a brutal, mechanical repricing of the cost of money across the entire financial system.
The Fed’s Worst-Case Scenario
You cannot isolate a $109 oil print. It acts as a massive tax on the global economy. More expensive crude means pricier diesel for trucking networks, higher jet fuel costs for airlines, and increased raw material prices for manufacturing.
The bond market sniffed this out immediately. Bond traders are essentially doing the Federal Reserve’s math for them.
If energy costs push headline inflation back up, Chairman Jerome Powell is completely boxed in. Traders who confidently built portfolios around three interest rate cuts in 2026 are now aggressively dumping those bets. The market is waking up to the threat of “higher for longer” all over again.
Shifting Rate Cut Odds
| Fed Meeting | Previous Cut Odds | Current Cut Odds |
|---|---|---|
| September 2026 | 65% | 35% |
| December 2026 | 80% | 55% |
Inventories Leave Zero Margin for Error
Adding fuel to the fire, the latest data from the US Energy Information Administration (EIA) confirmed that domestic supplies are already thinning out. Commercial crude inventories fell by 4.3 million barrels.
We are now sitting uncomfortably below the five-year seasonal average. Gasoline stocks shrank as well. Refiners are running red-hot heading into the summer driving season, meaning there is essentially no shock absorber left in the American energy system.
Winklevoss Twins Commit $100 Million Bitcoin to Gemini Future, Shares Rise on Report
The International Energy Agency is already warning of a 1.8 million barrel-a-day structural deficit globally for 2026. While OPEC+ has spare capacity on paper, the group has shown very little urgency to flood the market and bail out Western economies during geopolitical flare-ups.
How the Smart Money is Rotating
This is not a blind panic, but it is a highly aggressive capital rotation. Institutional portfolio managers spent Friday moving money out of vulnerable sectors and seeking shelter.
- Energy Stocks: Catching massive bids as direct beneficiaries of $109 crude and tightening refining margins.
- High-Growth Tech: Facing intense selling pressure due to higher discount rates and rising Treasury yields.
- Consumer Staples: Seeing defensive positioning as analysts prepare for everyday shoppers to tighten their belts at the grocery store.
- The US Dollar: Strengthening rapidly as foreign carry trades unwind and investors hoard cash for safety.
The Three Scenarios Wall Street is Modeling
Financial desks hate uncertainty. Right now, risk managers are heavily modeling three distinct paths for the remainder of 2026. Keep in mind, these are institutional probability models, not guarantees.
Market Outlook Models
| Scenario | Oil Target | Market Reaction | Odds |
|---|---|---|---|
| Quiet De-escalation | $85 – $92 | Inflation cools, tech rally resumes, Fed cuts stay alive. | 25% |
| Simmering Status Quo | $100 – $115 | Sticky inflation, sideways stock market, high rates remain. | 50% |
| Kinetic Escalation | $130+ | Inflation shock, broad stock selloff, deep market correction. | 25% |
The Bottom Line for Your Portfolio
The days of relying on a smooth, uninterrupted glide path to lower interest rates are effectively over. Energy security is firmly back in the driver’s seat of the global economy.
When physical commodities choke, financial models break. We are watching that breakage happen in real-time. For everyday investors, this is a clear signal to stress-test your holdings. If you are entirely over-weighted in high-growth, rate-sensitive stocks, you are fully exposed to the next major move in the bond market.
Wall Street is currently repricing a world where physical friction dictates the cost of capital. Adjusting your strategy to account for that friction is not just smart—it is essential for navigating the back half of 2026.
Professional Financial Disclaimer
The information provided in this article is strictly for educational and informational purposes only. It does not constitute financial, investment, legal, or tax advice. Global commodities and equity markets are highly volatile and carry a substantial risk of loss. The analysis and viewpoints expressed reflect interpretations of public market data and economic events as of May 16, 2026. Past performance is never indicative of future results. Individuals should perform independent due diligence and consult with a licensed financial professional before making any investment decisions or altering their portfolio strategy.