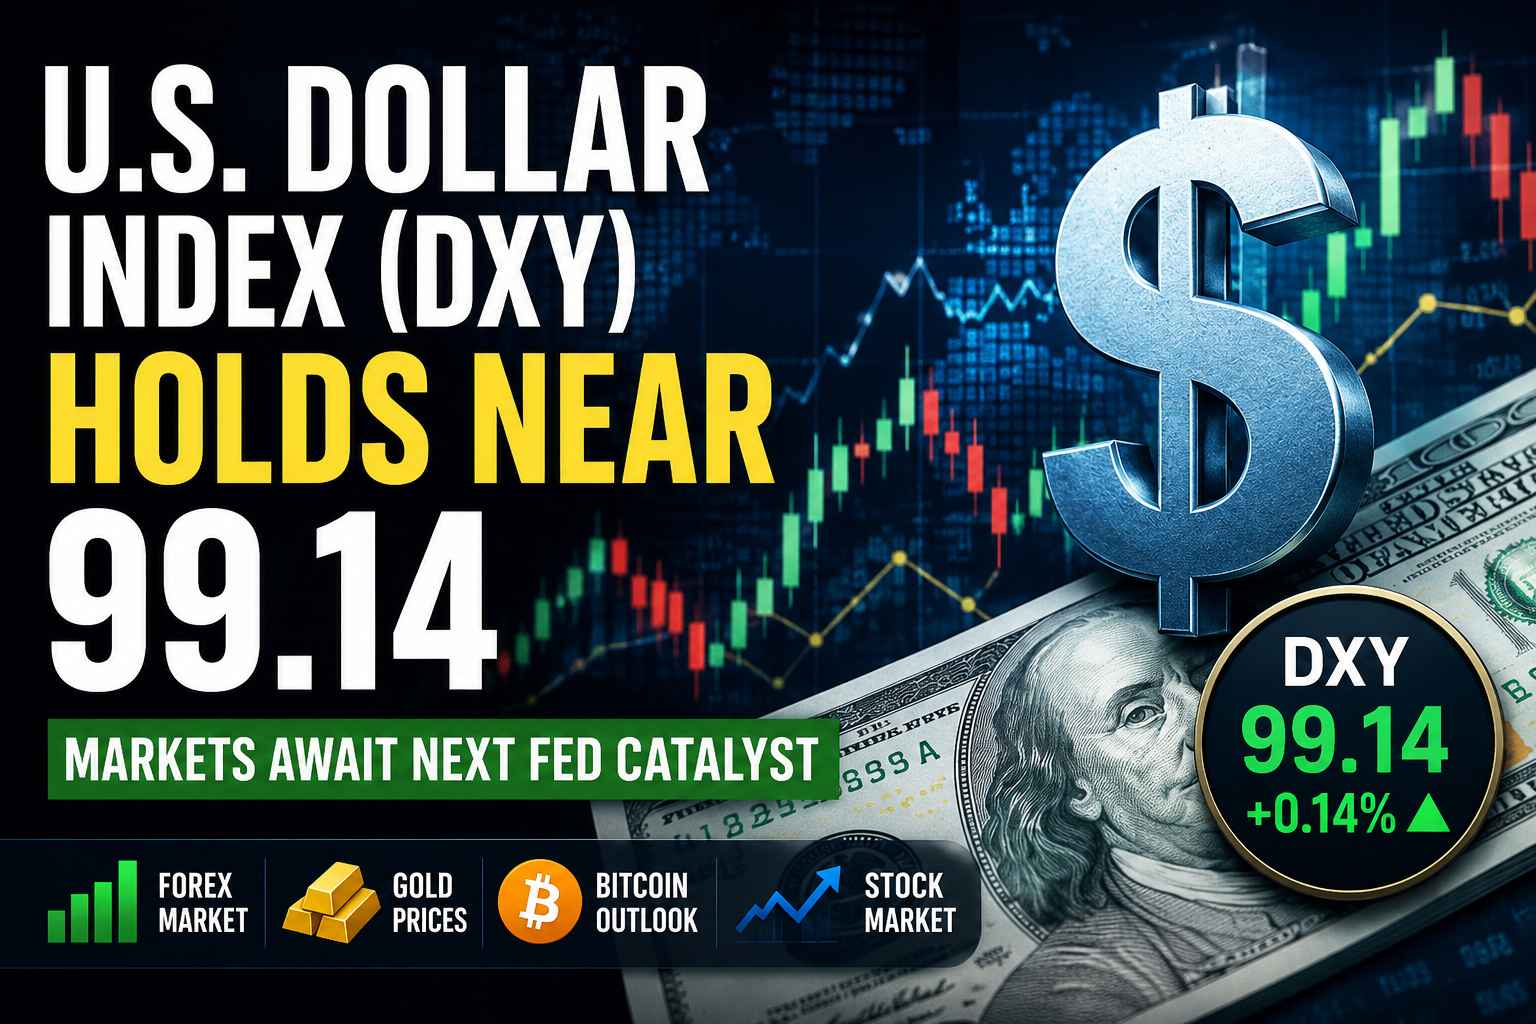
The U.S. Dollar Index (DXY) remains near 99.14 as traders monitor Federal Reserve policy, Treasury yields, stocks, gold, and cryptocurrency markets.
U.S. Dollar Index Consolidates Near 99.14 as Markets Await Next Fed Catalyst
The U.S. Dollar Index (DXY) traded near 99.14 on Tuesday, posting a modest gain of 0.14% as forex traders assessed mixed technical indicators and shifting global market sentiment. Rather than moving on a sudden fundamental shock, the index remained largely range-bound today as market participants awaited fresh inflation data and further signals from Federal Reserve officials regarding the future path of interest rates.
After opening the session at 98.98, the index found intraday buying interest, pushing it toward a daily high of 99.16. Despite this short-term bounce, the broader technical layout shows the dollar navigating a complex consolidation phase just below the psychological 100-point threshold.
For retail investors, equity traders, and cryptocurrency market participants, this specific pricing zone is highly significant. A subdued dollar generally acts as a tailwind for risk-on assets, multinational corporate earnings, and international currencies. However, with technical oscillators flashing neutral and longer-term moving averages signaling potential overhead resistance, market participants are watching U.S. Treasury yields closely to dictate the dollar’s definitive trajectory in the days ahead.
Key Takeaways
- The DXY is trading near 99.14, posting a modest daily gain of +0.14%.
- Weekly momentum is largely flat (+0.01%), reflecting a “wait-and-see” approach from traders.
- The overall 1-month technical summary remains a “Sell” due to overhead moving average resistance.
- Cryptocurrency and equity markets continue to benefit from the sub-100 dollar environment.
- Traders are heavily focused on upcoming inflation data and U.S. Treasury yields for the next directional cue.
What Is the U.S. Dollar Index (DXY)?
The U.S. Dollar Index measures the value of the U.S. dollar against a geometric, trade-weighted basket of six major global currencies. The Euro accounts for the vast majority of the index at 57.6%, making the DXY highly sensitive to European Central Bank policies. It is followed by the Japanese Yen (13.6%), the British Pound (11.9%), the Canadian Dollar (9.1%), the Swedish Krona (4.2%), and the Swiss Franc (3.6%).
What Is Driving the Dollar Today?
Today’s price action reflects a market attempting to find equilibrium after recent volatility. The defense of the sub-99 level suggests continued buying interest in the U.S. dollar, preventing an immediate, deeper breakdown.
However, the lack of explosive upside momentum indicates that traders are hesitant to take massive directional bets. Several converging macroeconomic factors are keeping the DXY in this holding pattern:
- Federal Reserve Expectations: The primary driver of dollar strength is monetary policy. Traders are currently analyzing daily DXY movement to gauge whether the broader market expects the Fed to hold rates steady or pivot toward a rate-cutting cycle in the near term.
- Treasury Yields: The dollar traditionally moves in tandem with U.S. Treasury yields. Because foreign capital chases higher returns, any stabilization in bond yields typically translates to a stabilizing dollar.
- Inflation Outlook: The market is essentially in a holding pattern, waiting for the next major Consumer Price Index (CPI) and employment prints before committing to a structural trend.
DXY Performance Breakdown Across Every Timeframe
To accurately forecast the trajectory of the U.S. Dollar Index, it is necessary to examine its verified performance history across multiple time horizons. Looking at the data from the latest session:
| Timeframe | Performance |
|---|---|
| 1 Day | +0.13% |
| 5 Days | +0.01% |
| 1 Month | +0.31% |
| 6 Months | -0.37% |
| Year to Date (YTD) | +0.91% |
| 1 Year | +0.04% |
| 5 Years | +10.52% |
| 10 Years | +4.19% |
The short-term data reveals an asset in tight consolidation, with the 5-day performance flatlined at +0.01%. The medium-term metrics (6 months to 1 year) show a market searching for structural direction. However, the long-term 5-year (+10.52%) and 10-year (+4.19%) performance data highlights the structural macroeconomic resilience the dollar has maintained throughout recent monetary cycles.
Key Levels Traders Are Watching
In a technically driven market, identifying precise levels of support and resistance is crucial. Based on current moving averages and psychological barriers, here are the key zones traders are monitoring:
| Level | Importance |
|---|---|
| 100.00 | Major psychological resistance |
| 100.13 | 20-Day EMA resistance |
| 99.03 | 10-Day EMA support |
| 98.50 | Key short-term support |
What the Technical Indicators Signal
A look under the hood at the 1-month technical summary gauge reveals a market flashing heavily mixed signals. The overall technical summary currently points to a “Sell” bias, driven largely by overhead moving averages, while oscillators remain squarely in neutral territory.
The Relative Strength Index (RSI 14) currently sits at 46.520. Because this is slightly below the 50 midline, it suggests a mild bearish bias, but it is far from oversold territory. The Stochastic %K (14, 3, 3) reads 30.640, remaining definitively Neutral. The absence of any “Buy” signals among the tracked oscillators confirms that explosive upside momentum is currently lacking.
However, the moving averages tell a story of a market attempting a short-term recovery within a medium-term downtrend. The fast short-term averages—specifically the 10-day Exponential Moving Average (EMA) at 99.031—are flashing “Buy,” confirming the recent daily bounce. Moving into the medium-term, dynamic levels are acting as overhead resistance. The 20-day EMA sits at 100.129, and the 50-day Simple Moving Average (SMA) forms a formidable ceiling at 103.068. The price being trapped below these critical medium-term moving averages is the primary reason the overall technical summary leans toward a bearish bias for the time being.
Dollar Index vs. Broader Markets: Cross-Asset Impact
Because the dollar touches every corner of the financial ecosystem, today’s consolidation has immediate impacts across other major asset classes. Here is how the dollar’s current positioning aligns with broader financial markets:
| Asset | Current Market Dynamics |
|---|---|
| DXY (U.S. Dollar Index) | +0.14% (Consolidating near 99.14) |
| Bitcoin (BTC) & Crypto | Monitoring overhead DXY resistance; historically benefits from sub-100 dollar environments as risk appetite expands. |
| Gold (XAU/USD) | Testing technical levels; remaining highly sensitive to U.S. Treasury yields and daily dollar fluctuations. |
| Nasdaq / S&P 500 | Assessing corporate earnings amidst a favorable currency translation environment, as a subdued dollar protects foreign revenues. |
What Could Move the Dollar Next?
Upcoming U.S. inflation reports, labor market data, Treasury yield movements, and Federal Reserve commentary are expected to be the primary catalysts for the Dollar Index over the coming weeks. Any surprise in these economic indicators could trigger a sudden breakout above the 100-resistance level or apply renewed downside pressure below the 99 level. Traders will be looking for clear deviations from expected inflation metrics to determine the dollar’s true trajectory for the quarter.
Frequently Asked Questions (FAQ)
Is DXY bullish or bearish right now?
As of current trading, the DXY presents a mixed outlook. The Year-to-Date (YTD) performance shows a modest +0.91% gain, but medium-term technical indicators (like the 20-day and 50-day moving averages) are flashing “Sell,” indicating a broader neutral-to-bearish consolidation phase.
Can DXY reach 100 again?
Yes, reaching 100 is entirely possible. The DXY frequently tests the 100-level as a major psychological zone. To reach and hold above 100, the market would likely need a macroeconomic catalyst, such as higher-than-expected U.S. inflation data or rising Treasury yields.
Why is the dollar index below 100?
The index is trading below 100 primarily due to market expectations surrounding Federal Reserve monetary policy, stabilizing global risk sentiment, and resilience in major counterpart currencies like the Euro. A sub-100 dollar generally reflects a stable global liquidity environment.
How does DXY affect Bitcoin price?
Historically, the DXY and Bitcoin share an inverse relationship. A falling or subdued Dollar Index implies expanding global liquidity and higher investor risk appetite, which traditionally serves as a supportive macroeconomic backdrop for Bitcoin to appreciate.
What happens if DXY falls below 98?
A sustained move below the 98 level could signal weakening dollar momentum. This would likely encourage a broad depreciation of the U.S. dollar, supporting higher commodity prices (like gold and oil) and increased capital inflows into equities and digital assets.
What currencies have the biggest weight in DXY?
The U.S. Dollar Index is heavily weighted toward European currencies. The Euro is the largest component by far, making up 57.6% of the basket. It is followed by the Japanese yen (13.6%), the Pound sterling (11.9%), the Canadian dollar (9.1%), the Swedish krona (4.2%), and the Swiss franc (3.6%).
The U.S. Dollar Index (DXY) is currently navigating a highly nuanced technical landscape. Consolidating near 99.14, the index faces overhead resistance from medium-term moving averages while finding short-term support. As the ultimate barometer for global liquidity, traders across forex, equities, and cryptocurrency markets are watching closely; the dollar’s ability to reclaim the 100-level—or break downward—following the next major economic data print will likely dictate the performance of risk assets in the weeks ahead.